Campaigns Insights
The Campaigns provides a comprehensive overview of campaign performance over a one-month period. The campaign insights enable businesses to evaluate campaign effectiveness, optimize targeting strategies, and maximize return on investment (ROI) by understanding how different campaigns impact customer behavior and sales within a defined timeframe.
Things to Know
You must have Admin, Marketing Manager, or be a Franchisee user with Insights role permissions to view Campaigns Insights.
You must first apply the required filters to view your results. The minimum required Campaigns Insights filters are Start Date, End Date and at least 1 store location.
Franchisee users can only view data for the stores they have permissions to access. Additionally, they can only view campaign reports for the campaigns they created.
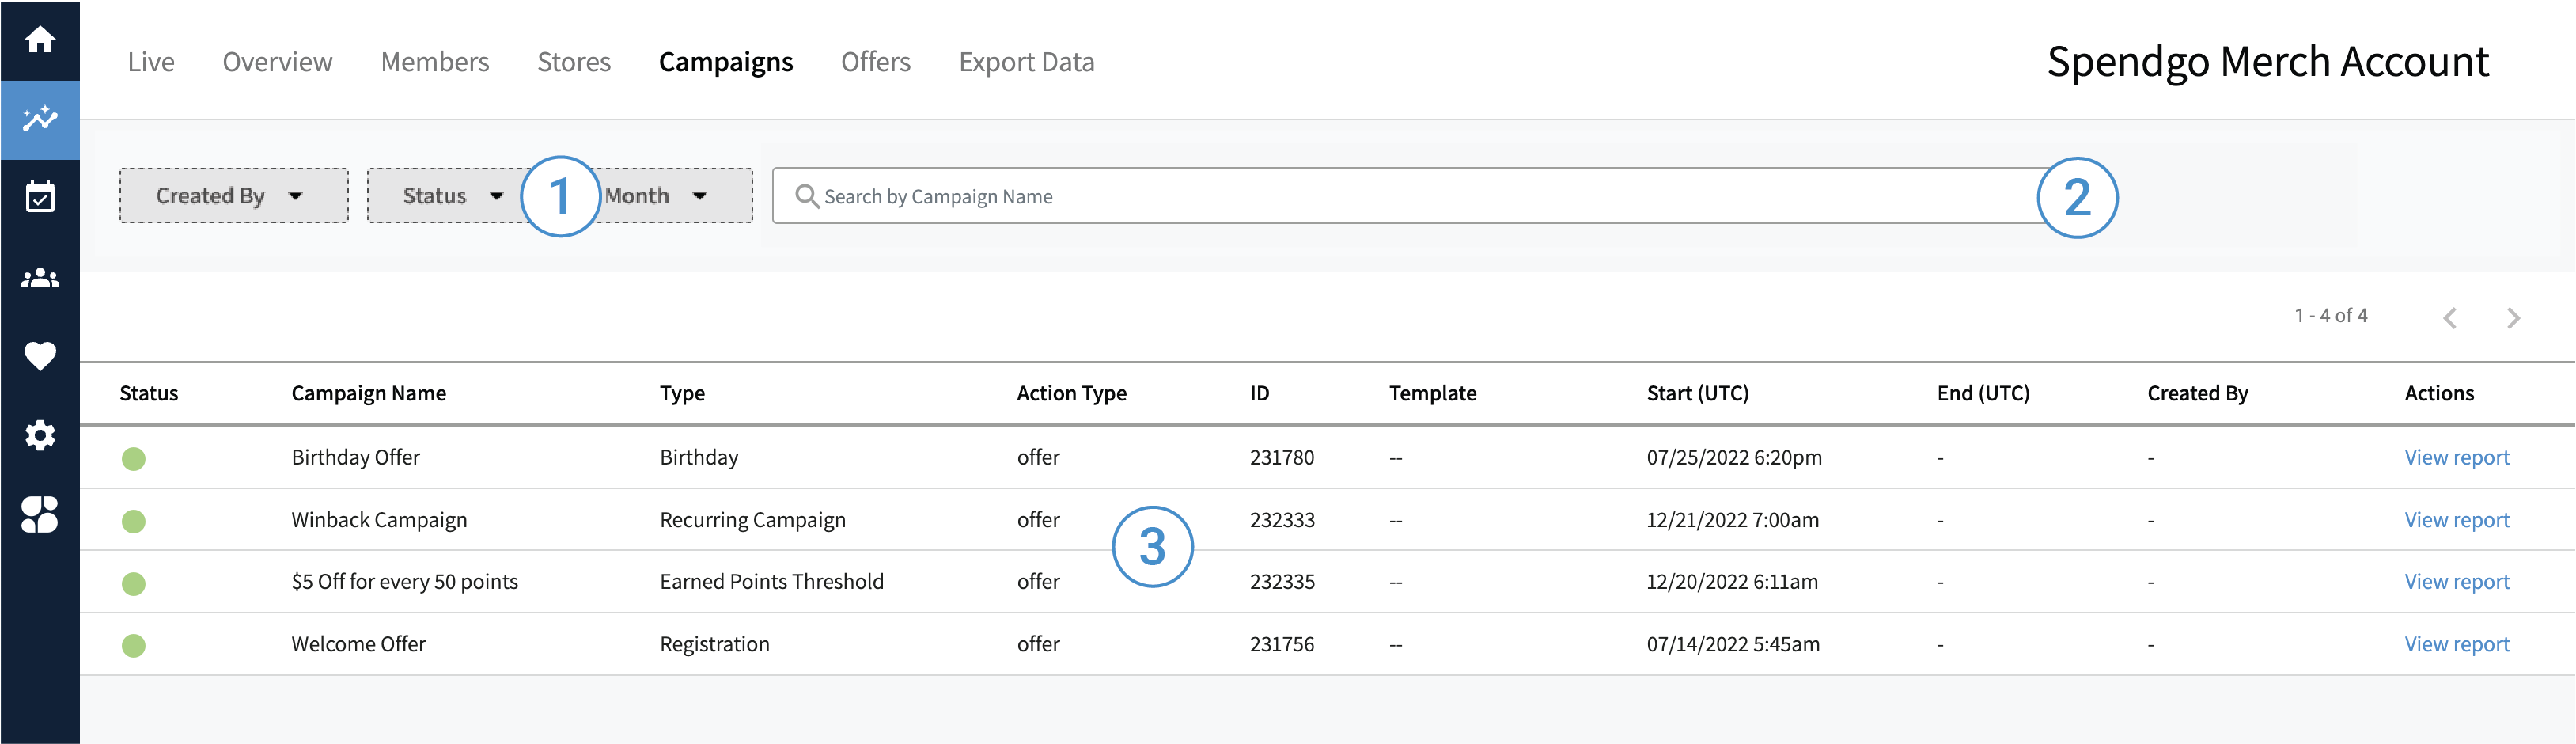
1. Filter Your Results
On the Campaign Insights page, you can filter results using the following options:
Created By — Filter by selecting the User(s) who created the campaign(s).
Status — Filter by campaign status:
Done — Completed campaigns.
Live — Active campaigns.
Pending — Campaigns that have not started yet (no data will be displayed in a pending report because it has not begun).
Month — Select the month during which the campaign is live.
2. Search
Search for your campaign name to refine your results to the exact report.
3. View Reports
Click “View Report” in the campaign row you would like to see specific performance metrics on. Use the following labeled image to find your way around the Campaign specific report.
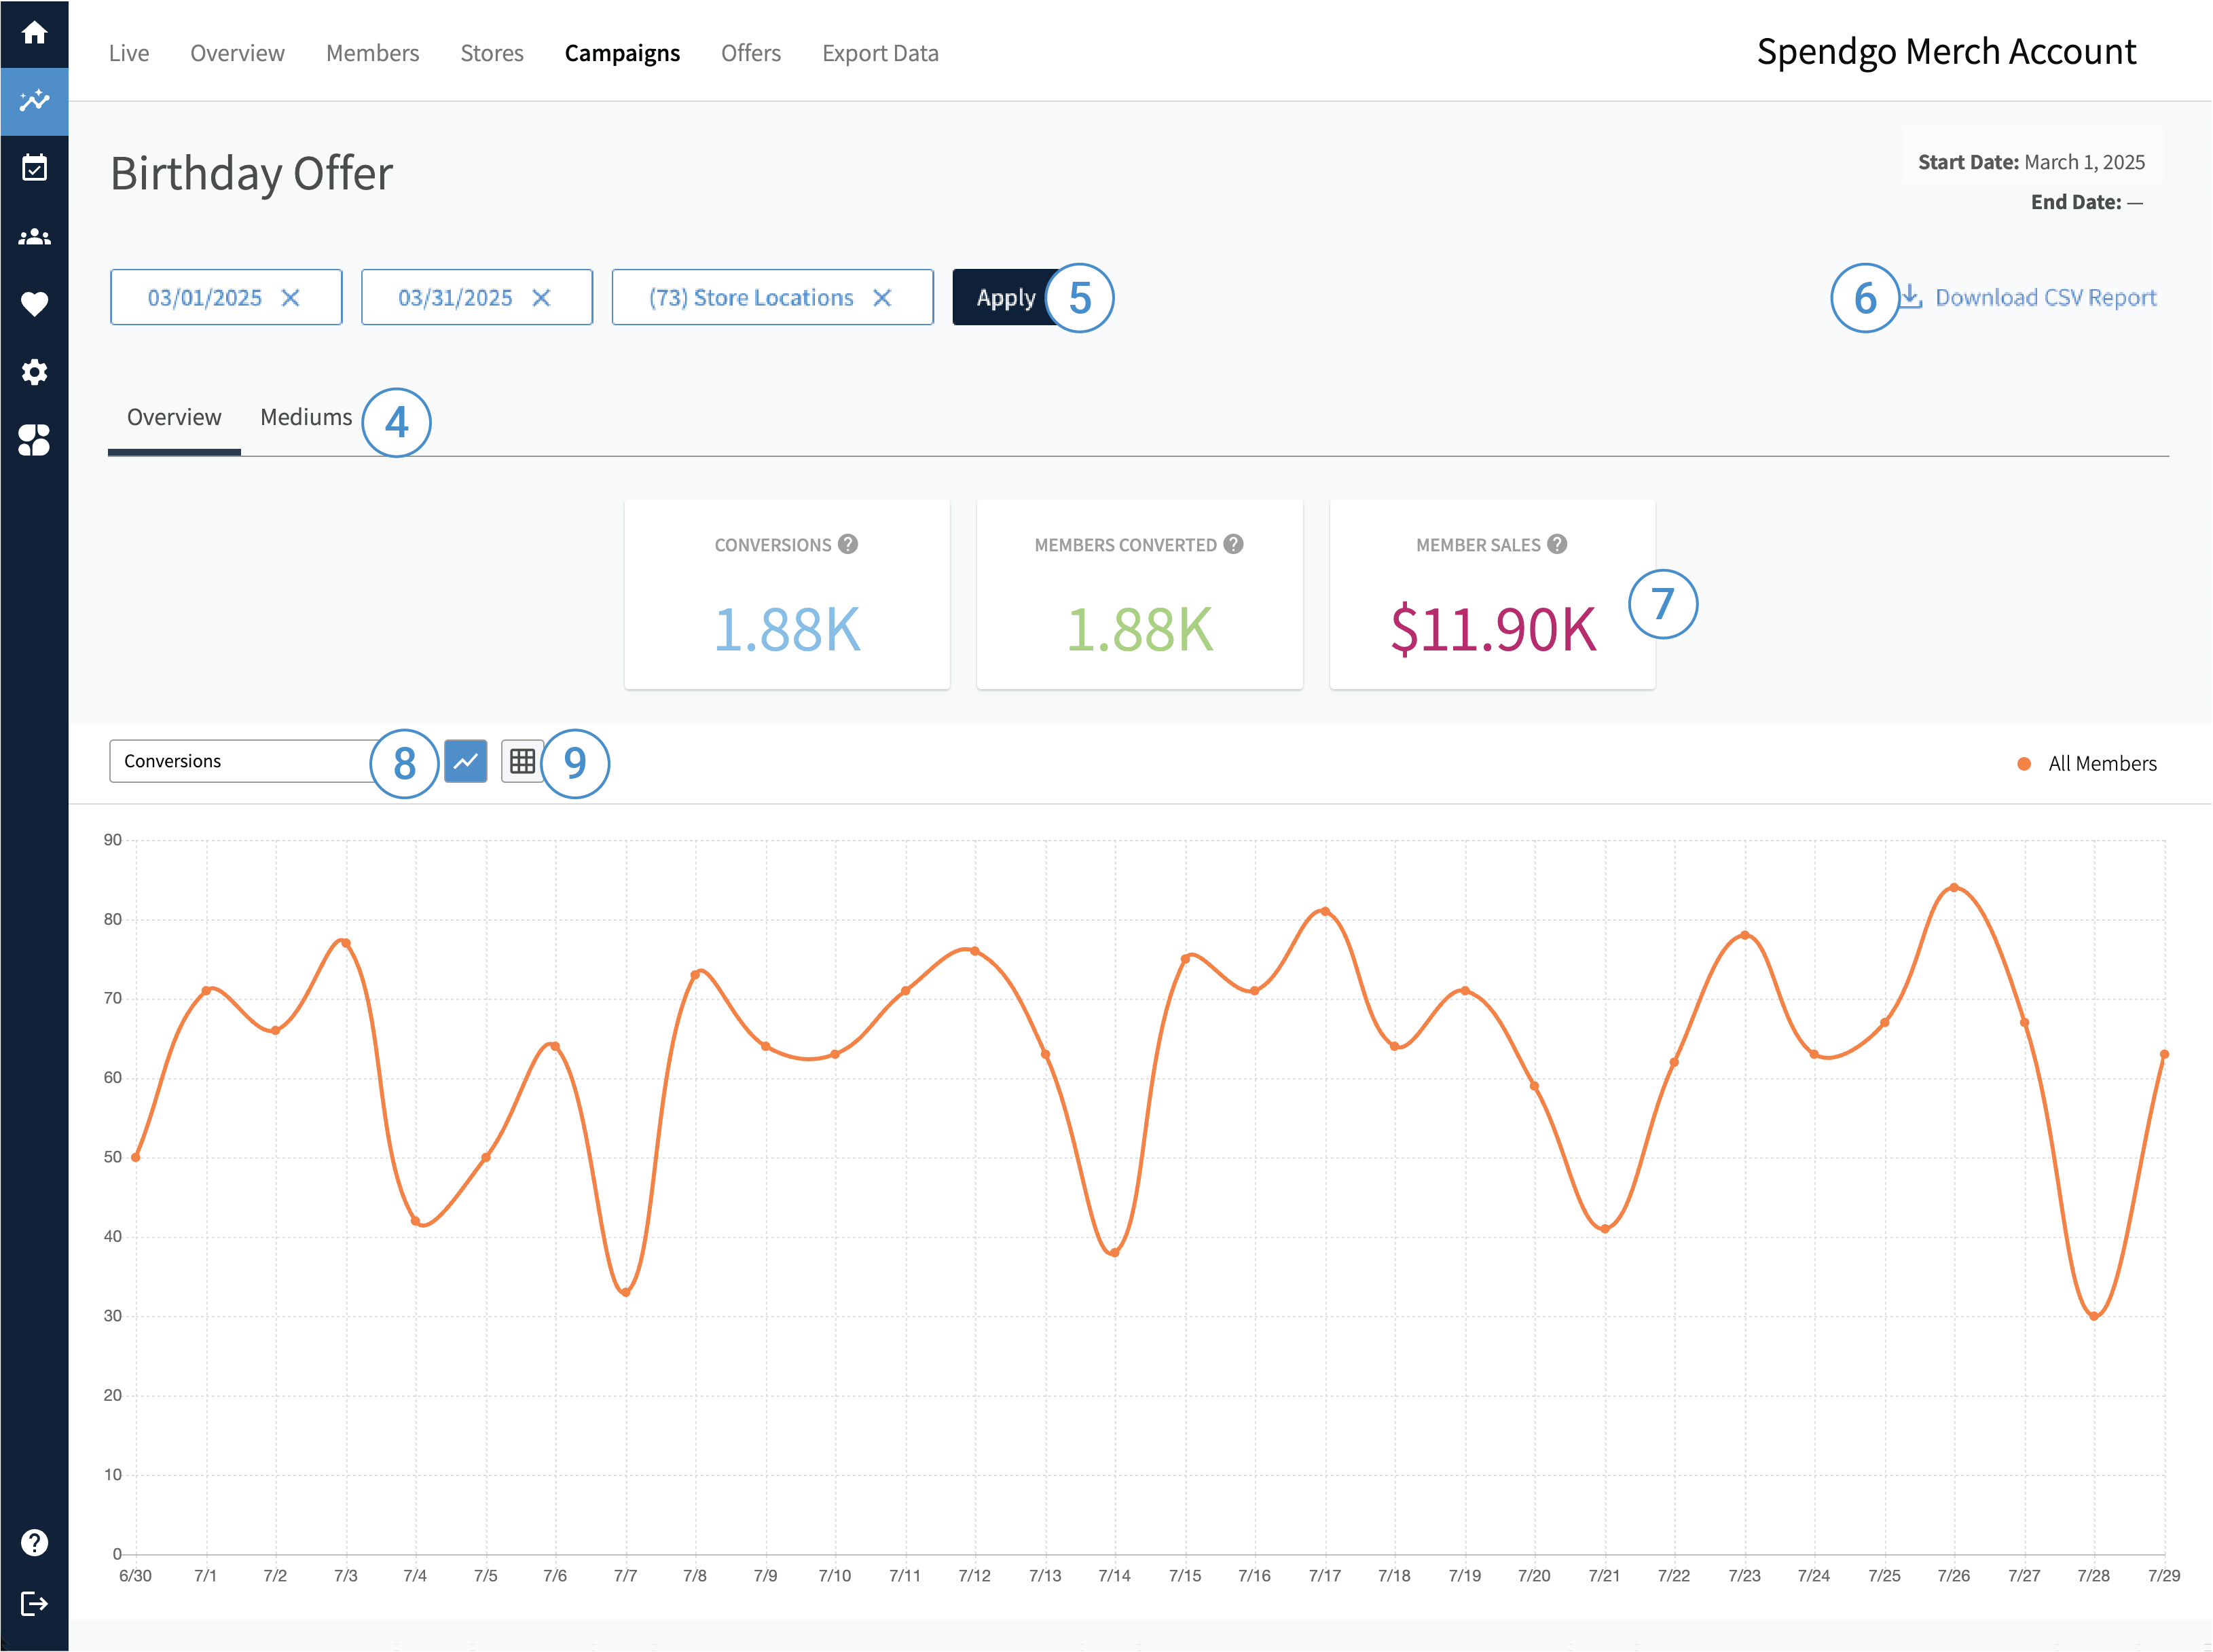
4. Navigate to Different Key Performance Indicators (KPIs) and Medium Stats
The sub-navigation menu bar provides links to:
Overview — Overview of your campaign’s performance.
Mediums — Enabled only when the campaign included an Email or SMS send. Provides a count of the sends that were Delivered for each medium.
Note, only one medium is ever associated with a campaign at a time.
5. Download CSV Report
You can download the visible report as a comma-separated values (CSV) file to perform your own reporting or view the raw data for further analysis. Learn more about Download CSV Reports.
6. Filter Your Results
To view relevant data on the Campaign page, all three filters below are required:
Start Date — Select any date in the past. This filters purchase, visit, and member event data based on the selected start date.
End Date — Select any date in the past, up to 31 days after the chosen Start Date. This defines the end of the filter range for all applicable data.
Store Locations — Select one or more active store locations. Purchase and visit data will be limited to the locations selected. Closed stores are not shown in the Store selector, and their data is excluded.
Note, there is a “No store” option which in some cases occurs when a member is imported without a favorite store preference.
Purchase, visit, and offer usage data is attributed to the local store time where the event took place. Whereas, any member profile data – such as their first association with your brand will be based in Coordinated Universal Time (UTC).
7. View Key Performance Indicators (KPIs)
Campaign results are calculated differently depending on whether the campaign is an Offer campaign or a Messaging (Email or SMS) campaign.
Conversions — The total number of members and non-members who completed a qualifying action, indicating the overall effectiveness of the campaign in driving engagement.
Offer campaigns: Counts all purchases where the campaign offer was applied. Results are shown by day.
Email or SMS campaigns: Counts all purchases made by targeted members within two weeks of receiving the message. Results are shown by day.
Members Converted — The number of existing members who made a purchase as a result of the campaign, highlighting the campaign's success in activating and retaining loyal customers.
Offer campaigns: Counts members who made a purchase using the offer. A member who used the offer multiple times will be counted only once on the first time they used the offer. Results are shown by day.
Email or SMS campaigns: Counts unique members who made at least one purchase within two weeks of receiving the message. Each member is counted once during this period. Results are shown by day.
Member Sales — The total revenue generated from member purchases attributed to the campaign, providing a clear link between campaign outreach and customer spending behavior.
Offer campaigns: Includes the total purchase amount from members where the offer was applied. Results are shown by day.
Email or SMS campaigns: Includes the total purchase amount from members within two weeks of receiving the message. Results are shown by day.day.
8. View Campaign Chart Data
On the top left of the chart module, you can select to show “Conversions”, “Members Converted, or “Member Sales” trends or changes over a month’s period of time.
9. Change the Chart Visualization
On the top left of the Chart module, you can change your chart visualization to:
Line Chart — A graphical representation of the data over time using lines to show trends.
Time-of-Day Heat Map — A heat map that displays the data based on the day of the week and time of day, with varying colors indicating different levels of activity.