Live Insights
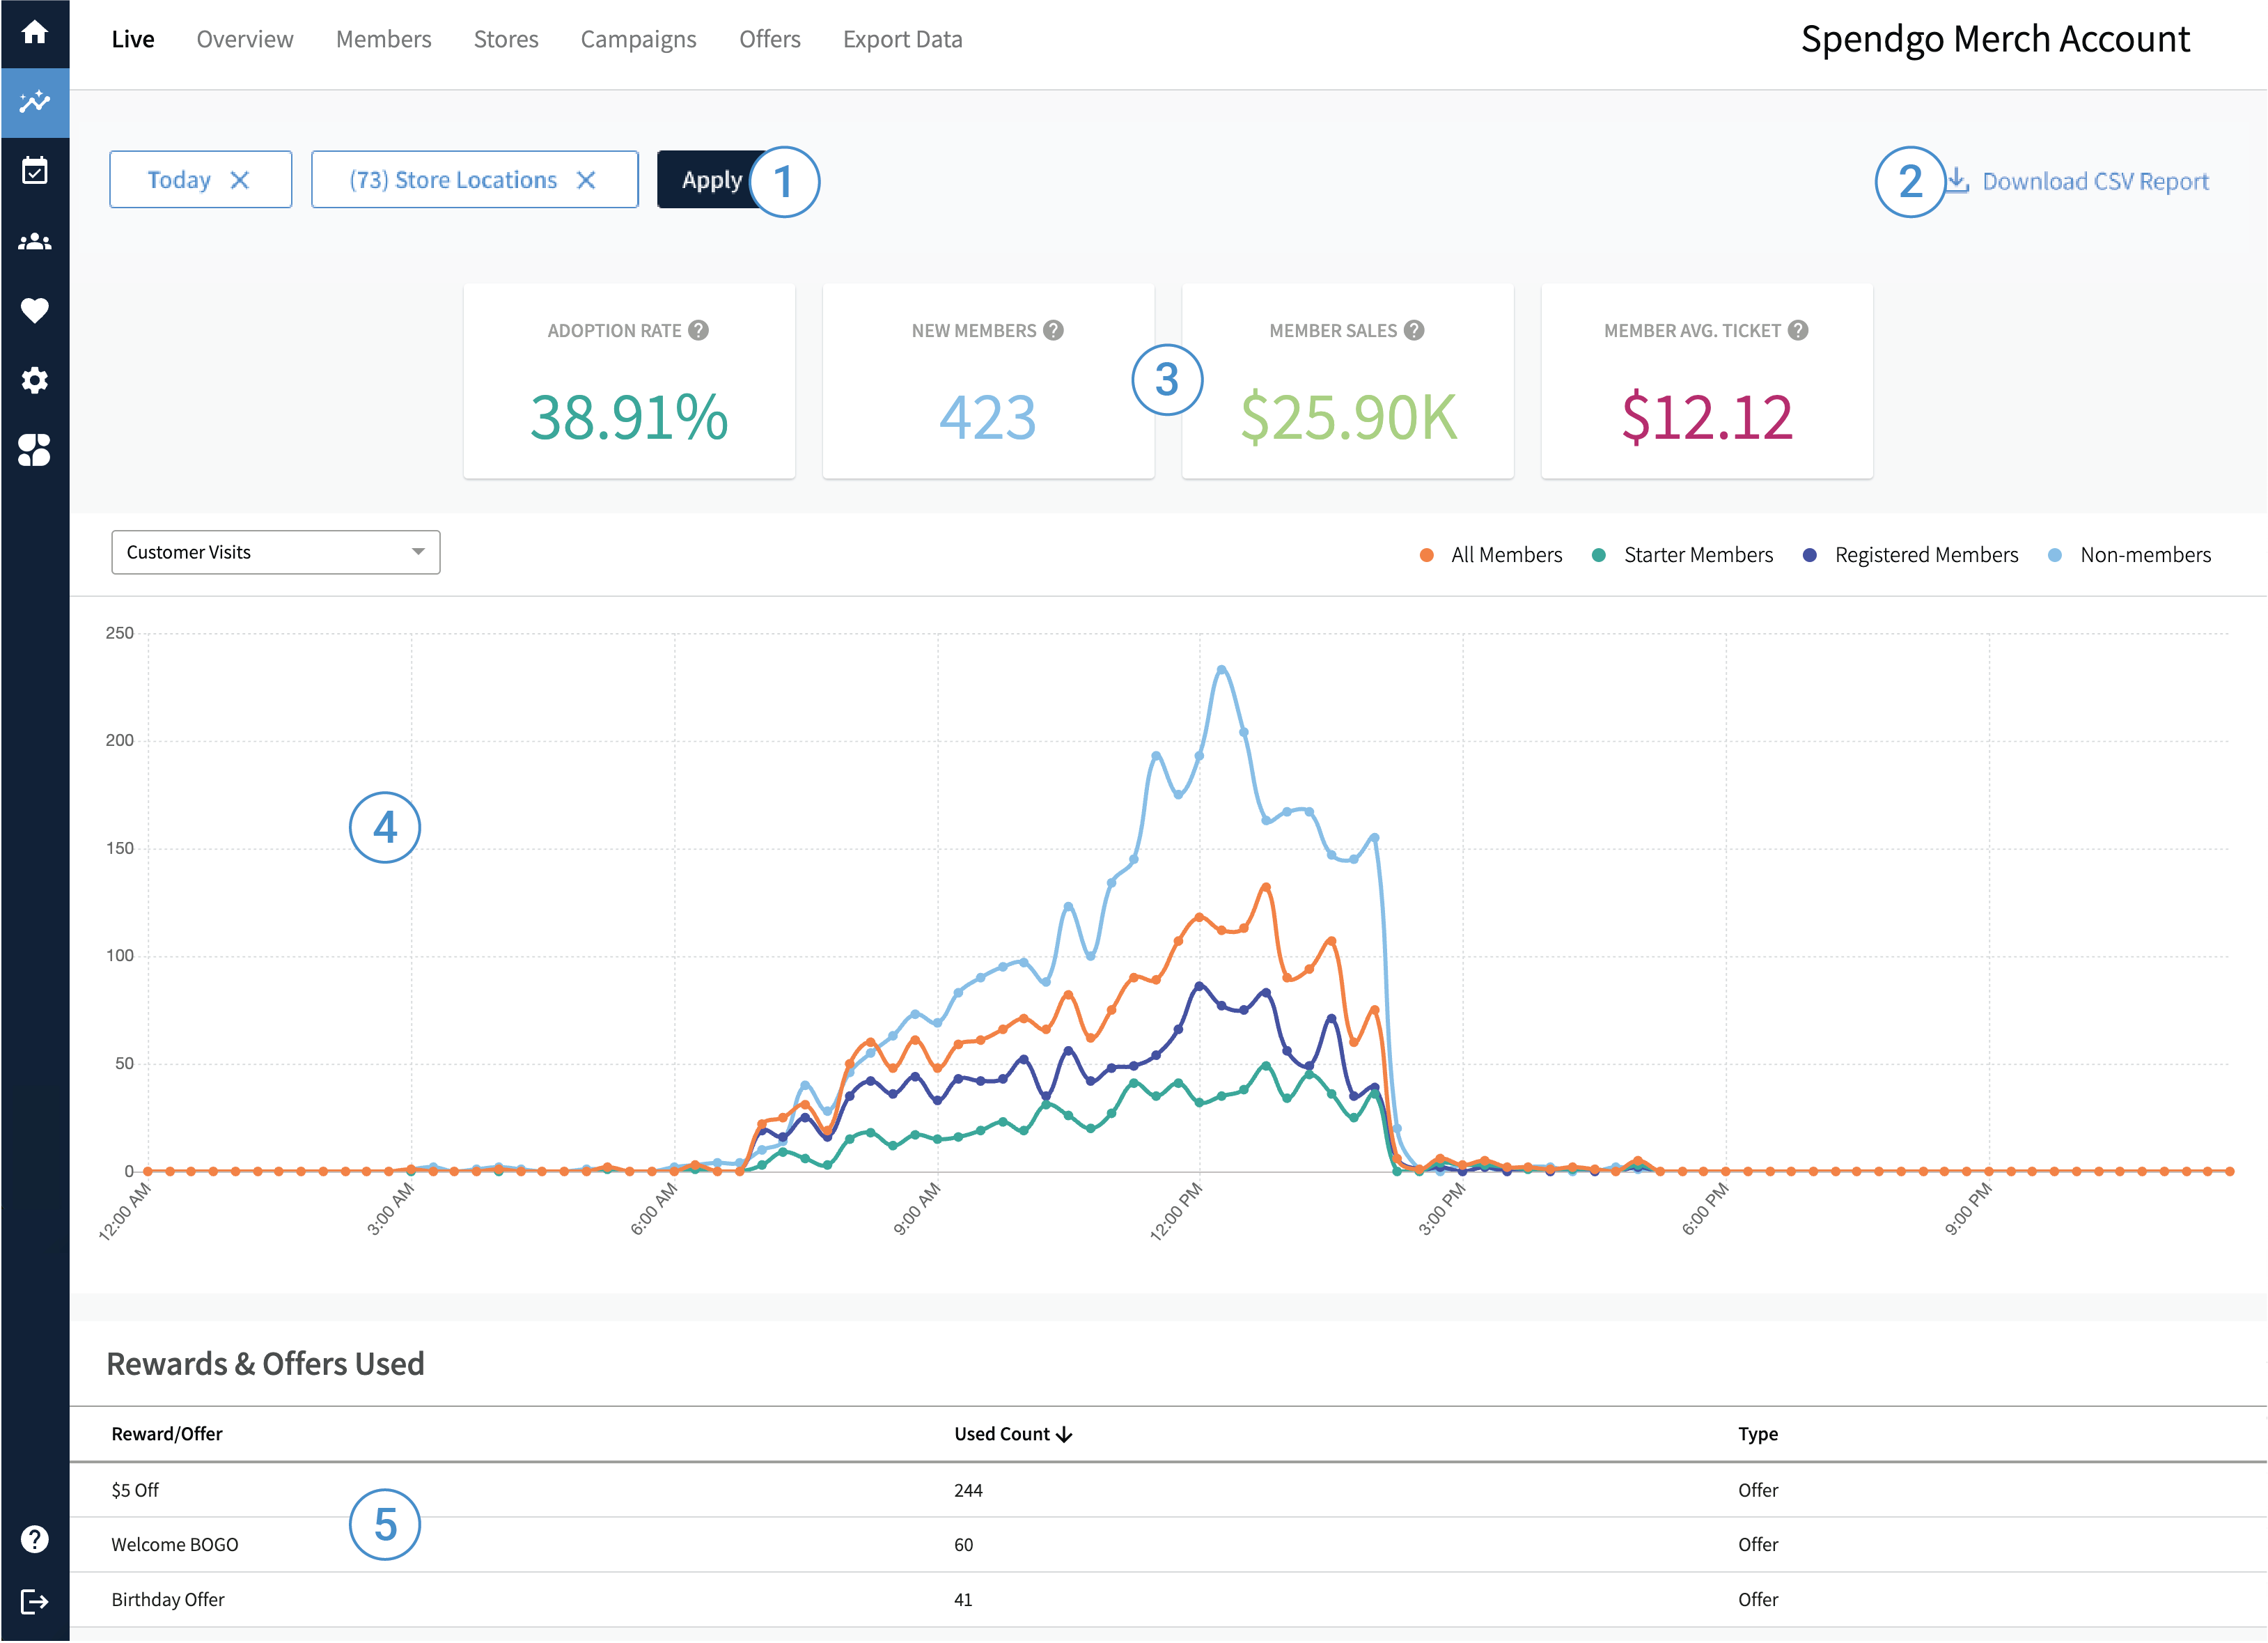
The Live page provides near-real-time insights into your loyalty program's performance, showing adoption rates, new sign-ups, sales, average transaction amounts, customer visits, and the use of rewards and offers.
Once Spendgo starts to receive event data – such as sales or member sign ups – the data will appear in the Live report in 15 minute increments. New member data is immediately collected once your sign up site is live, while other sales data may require additional integration setup with your Point of Sale (POS) or e-commerce providers.
All data shown in Live Insights is attributed based on the local timezone where a customer made their purchase and/or used their offer.
Things to Know
You must have Admin, Marketing Manager, or be a Franchisee user with Insights role permissions to view Live Insights.
You must first apply the required filters to view your results. The minimum required Live Insights filters are Day and at least 1 store location.
Franchisee users will only be able to view data associated with the stores they have permissions to.

1. Filter Your Results
To view relevant data on the Live page, all two filters below are required:
Day — Select a single day. The default is set to Today, but you may choose any past date. Purchase, visit, and member event data will be filtered based on the selected day.
Note, All data is attributed based on the local store time where the event occurred.Store Locations — Select one or more of your active store locations. Any purchase or visit data will be filtered to the data associated with your selection. Closed stores are not shown in the Store selector, and their data is excluded.
2. Download CSV Report
You can download the visible report as a comma-separated values (CSV) file to perform your own reporting or view the raw data for further analysis. Learn more about Download CSV Reports.
3. View Live Key Performance Indicators (KPIs)
Adoption Rate — The percentage of total purchases made by members. It is calculated by dividing the number of purchases made by members by the total number of purchases made by all customers.
New Members — The number of individuals who first associated with your brand, either by making a purchase, signing in, joining your SMS club, registering online, or whatever other integrated acquisition channel you have enabled with Spendgo.
Member Sales — The total revenue generated from purchases made by your members. Sales are calculated based on the purchase “Total” sent to Spendgo in any of your integrations.
Member Avg. Ticket — The average purchase value made by your members. It is calculated by dividing the total member sales by the number of purchases made by members.
4. View Live Chart Data
On the top left of the chart, you can choose to view live Customer Visits or select to view the Offer & Rewards used throughout the day.
Customer Visits — This report presents a line chart showing the total number of customer visits, segmented by all visitors, non-members, Starter members, and Registered members, over a 24-hour period from midnight to 11:59 PM local store time. It identifies peak and low traffic times, providing insights for optimizing operational strategies and resource allocation.
Offers & Rewards Used — This report presents a line chart showing the total number of offers and rewards redeemed, segmented by all members, Starter members, and Registered members, over a 24-hour period, from midnight to 11:59 PM local store time. It identifies peak and low usage times, providing insights to optimize campaign run-time strategies.
5. View Live Rewards & Offers Usage
Get a quick glance of the total number of which offers and rewards are being redeemed in the day.
Rewards & Offers Used — The total number of rewards and offers redeemed today so far.
